Personal tool / Project planning
Gantt
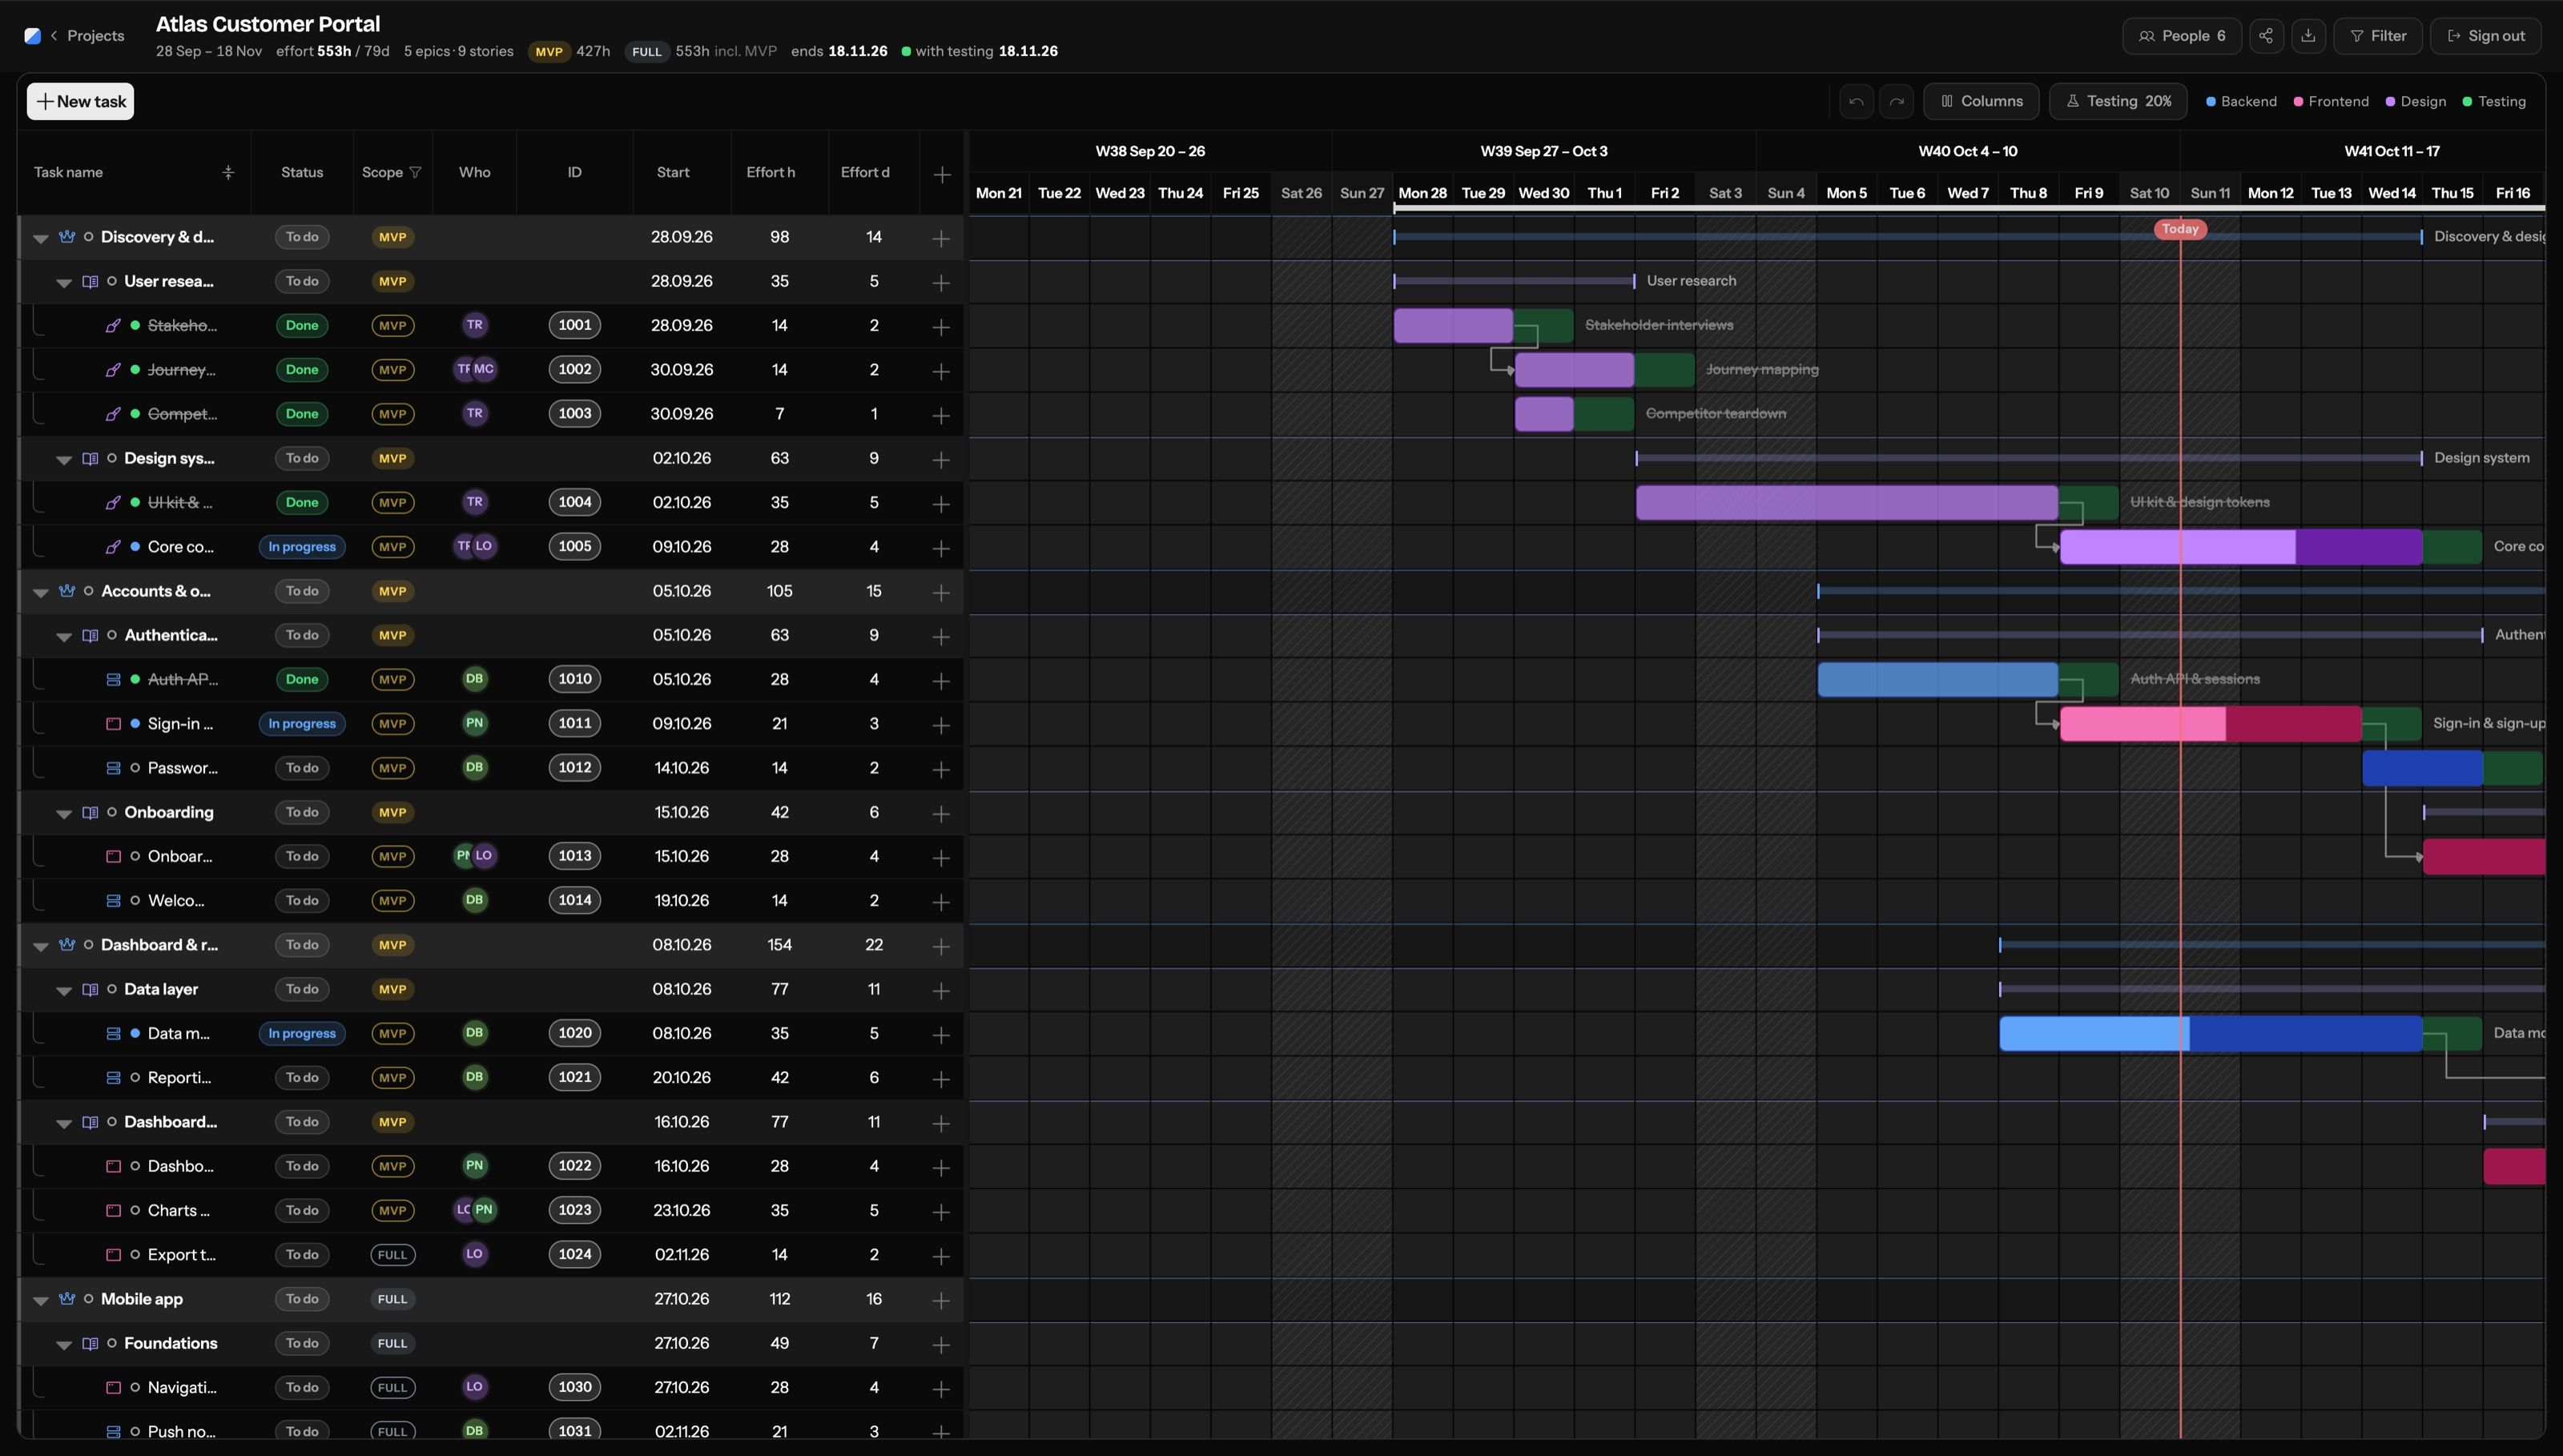
A planning tool I designed and built myself: epics, stories and tasks that roll up, and a plan that AI and your tracker can keep current.
- Segment
- Personal tool / Project planning
- Year
- 2026
- Services
- Product Design · UX/UI Design · Product Management · AI-assisted development
- My role
- Product, UX/UI design and development, built with Claude
- Result
- Designed and built to a working state in a single day, then refined over about four weeks (30 commits, around 12,000 lines of TypeScript) and used for my own project planning.
Overview
As a project manager I needed one place to plan scope, effort and dependencies, and nothing I tried fit the way I actually work. So I designed it and built it with Claude as my pair programmer, reaching a working version in one day and spending the following weeks perfecting it: a React and TypeScript app with Supabase for sign-in and storage. Plans can be shared as a read-only link or exported as a PDF, and because the plan lives in an open database, it can be connected to an AI assistant and the tracker of your choice so tasks and scopes update without manual edits. It has a full light and dark theme that follows your system setting. Every screen here uses made-up demo data.
Plan at three levels, with scope
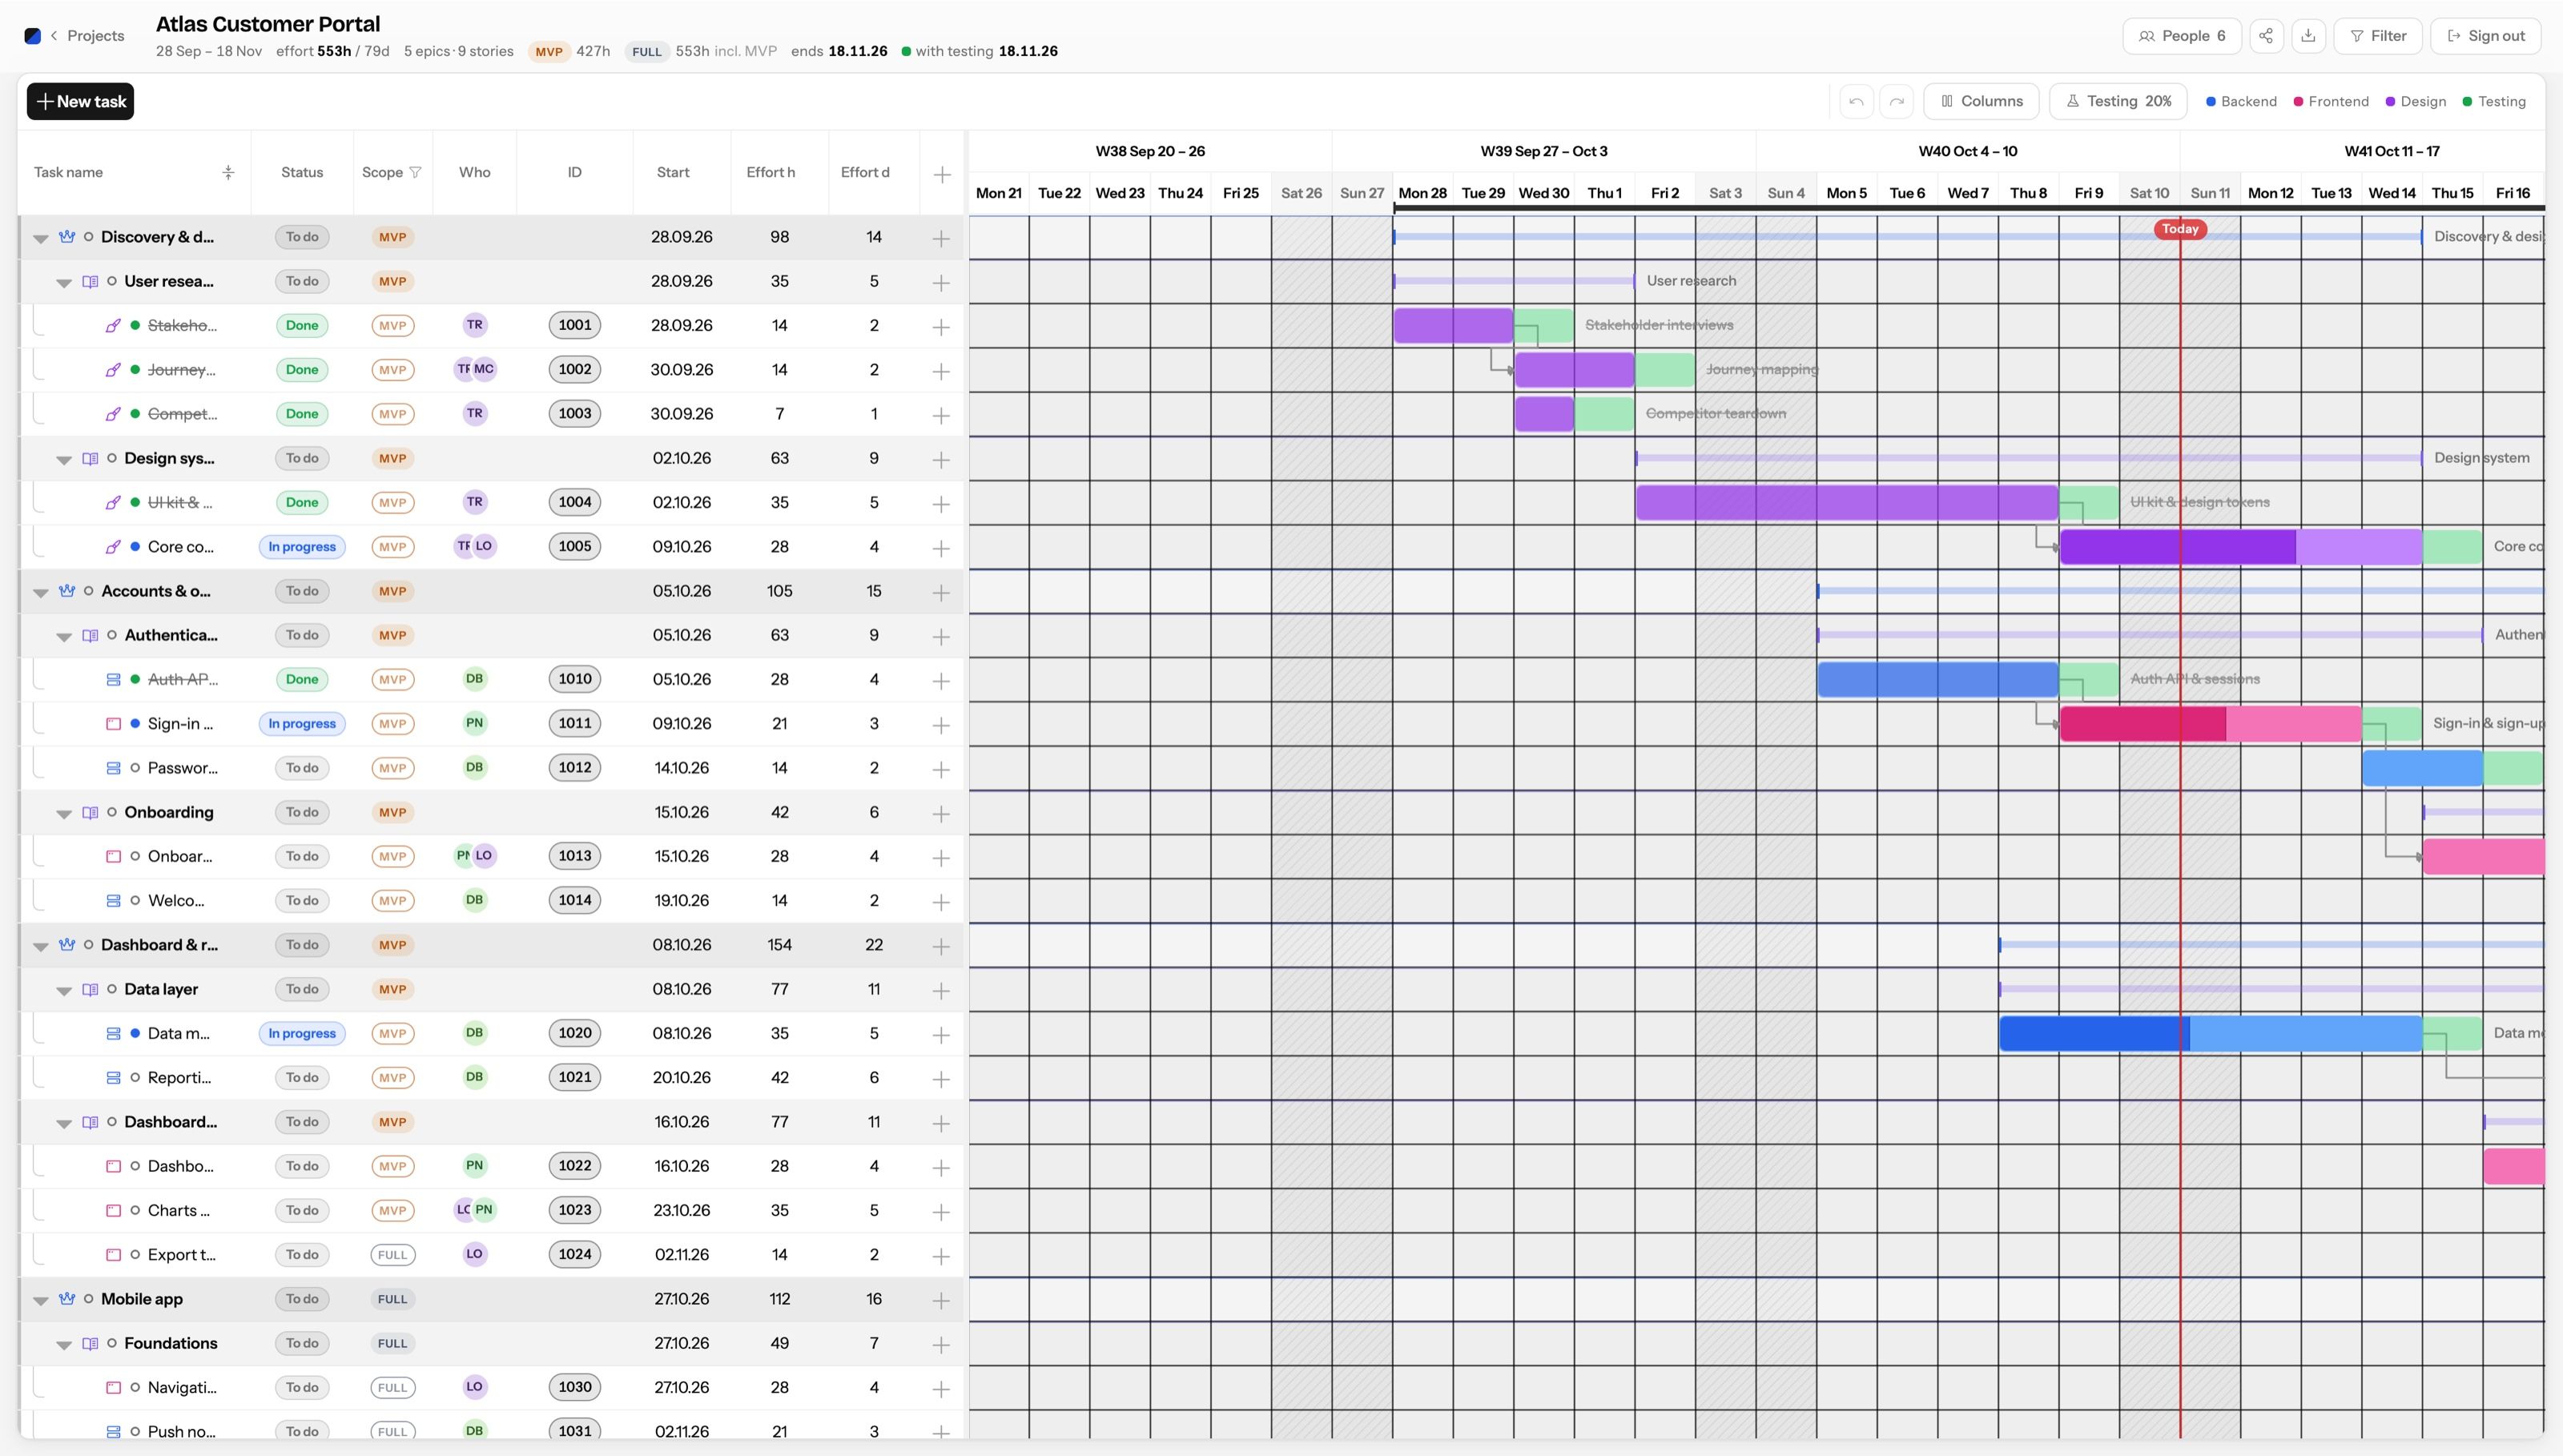
Work is organised as epic, story and task, and each tier rolls its dates, hours and days up from what's inside it. Bars are coloured by type, with a deeper segment for progress, and dependencies are drawn as connectors. Any epic or story can be marked MVP or full release, and the totals show the full figure including the MVP.
Connect it to AI and your tracker
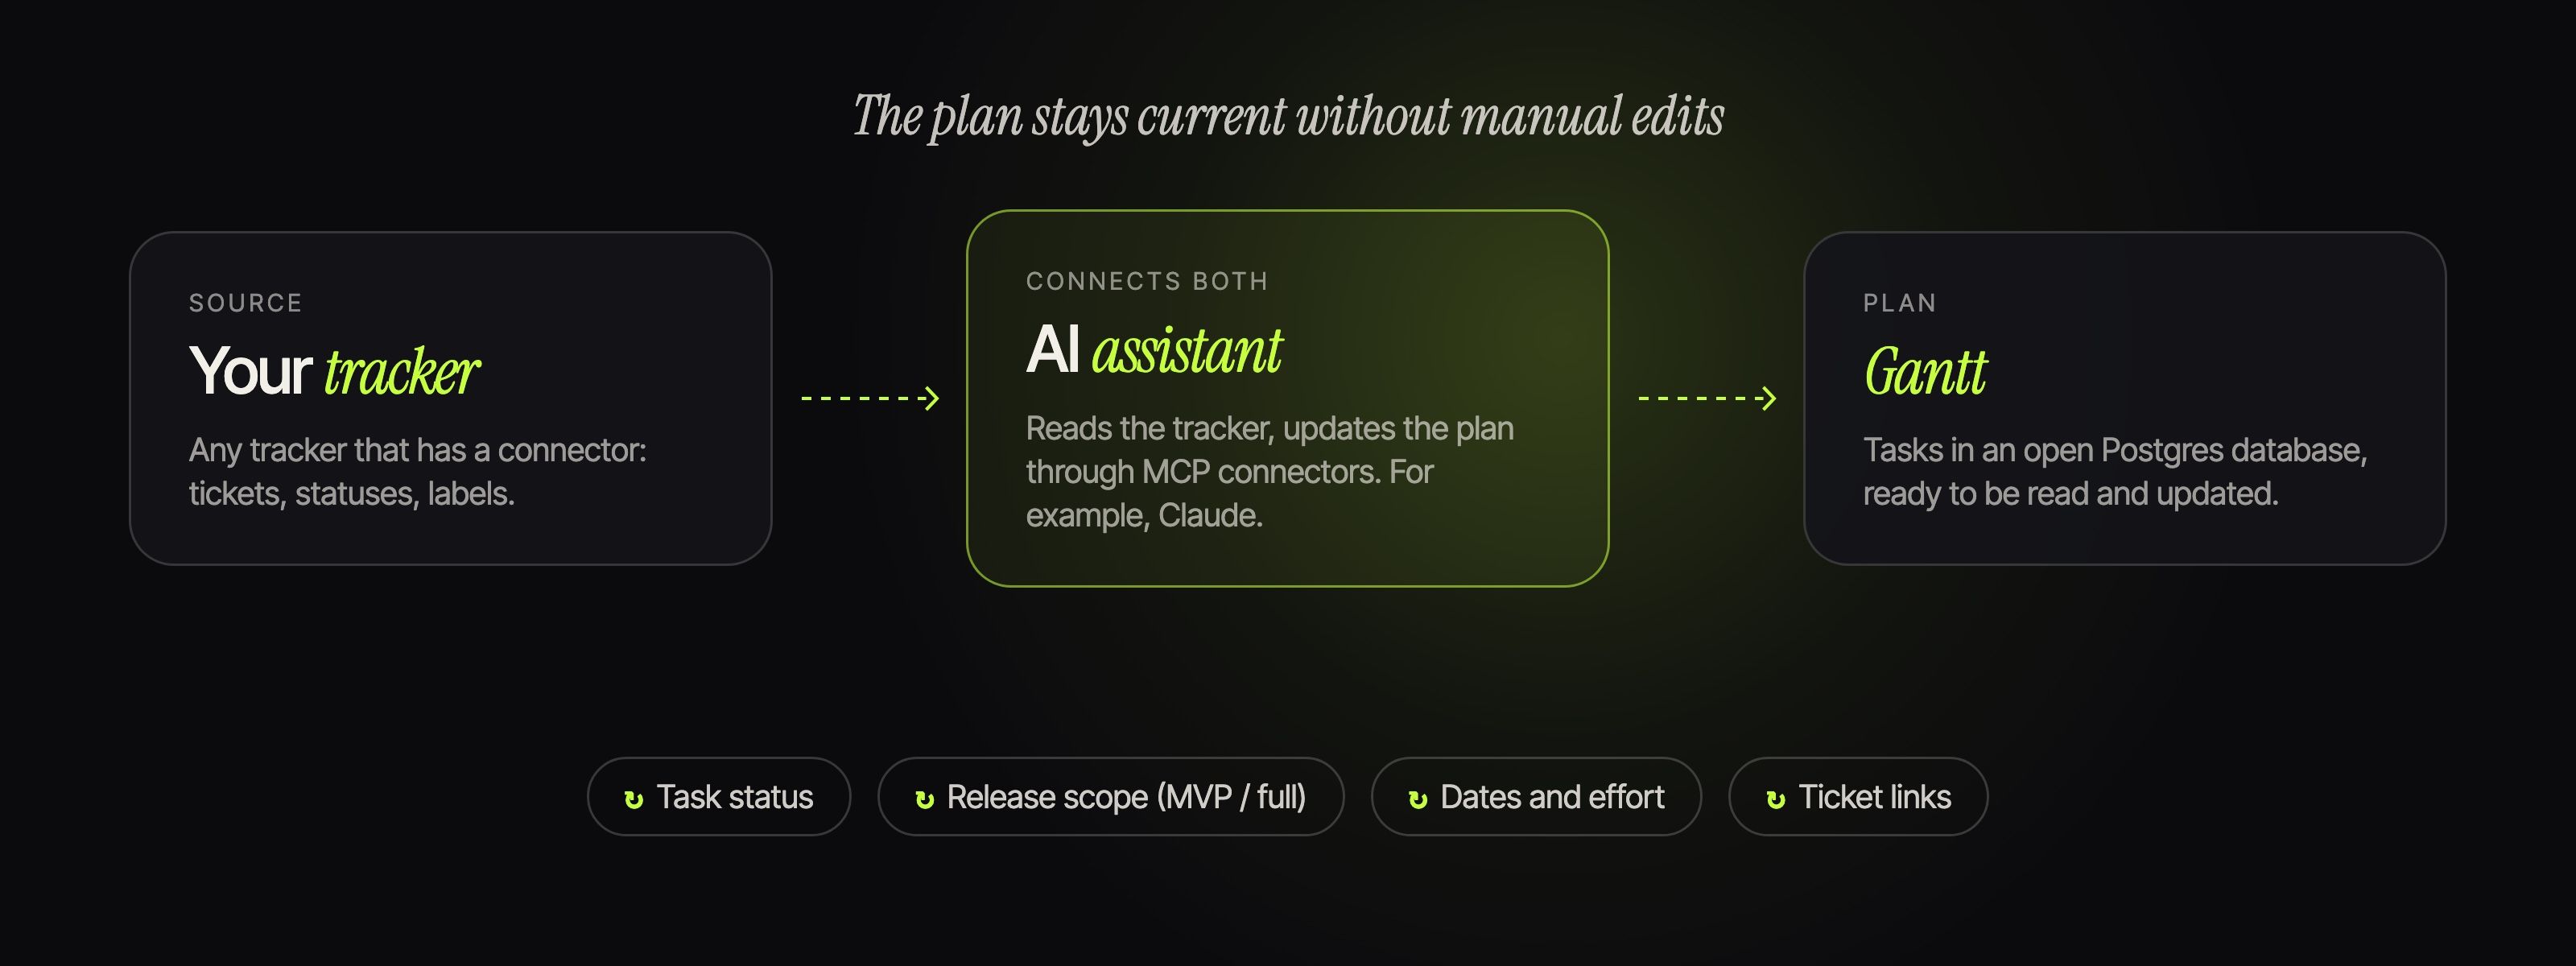
Every task keeps its ticket link, status, dates and release scope in an ordinary Postgres table. Connect an AI assistant to that database and to the tracker you use, through MCP connectors, and it can read the tickets and update tasks, statuses and scopes for you, so the plan stays current without editing it by hand.
Hours, not guesses
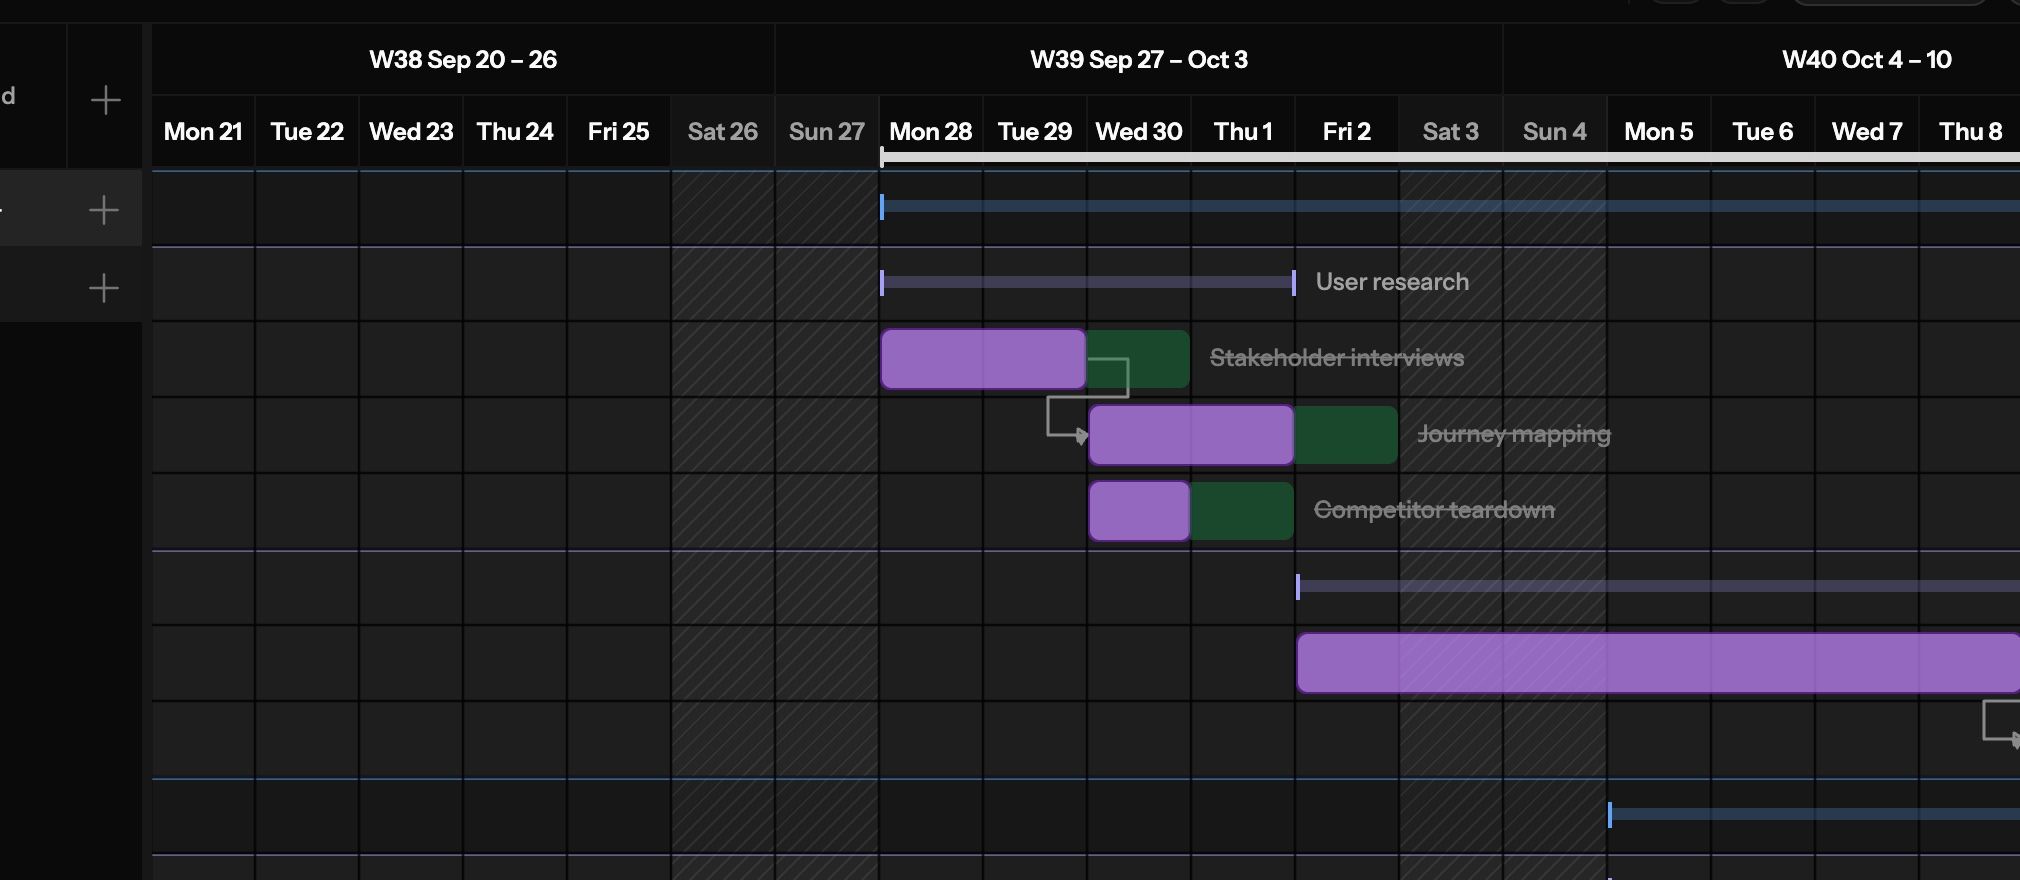
Effort is entered in hours or days and kept in sync, with seven hours counting as one working day. Weekends never count as working time: a task that runs into a weekend simply carries on the next working day, so the plan and its end date overrun the weekend instead of squeezing work into it.
Testing built into the estimate
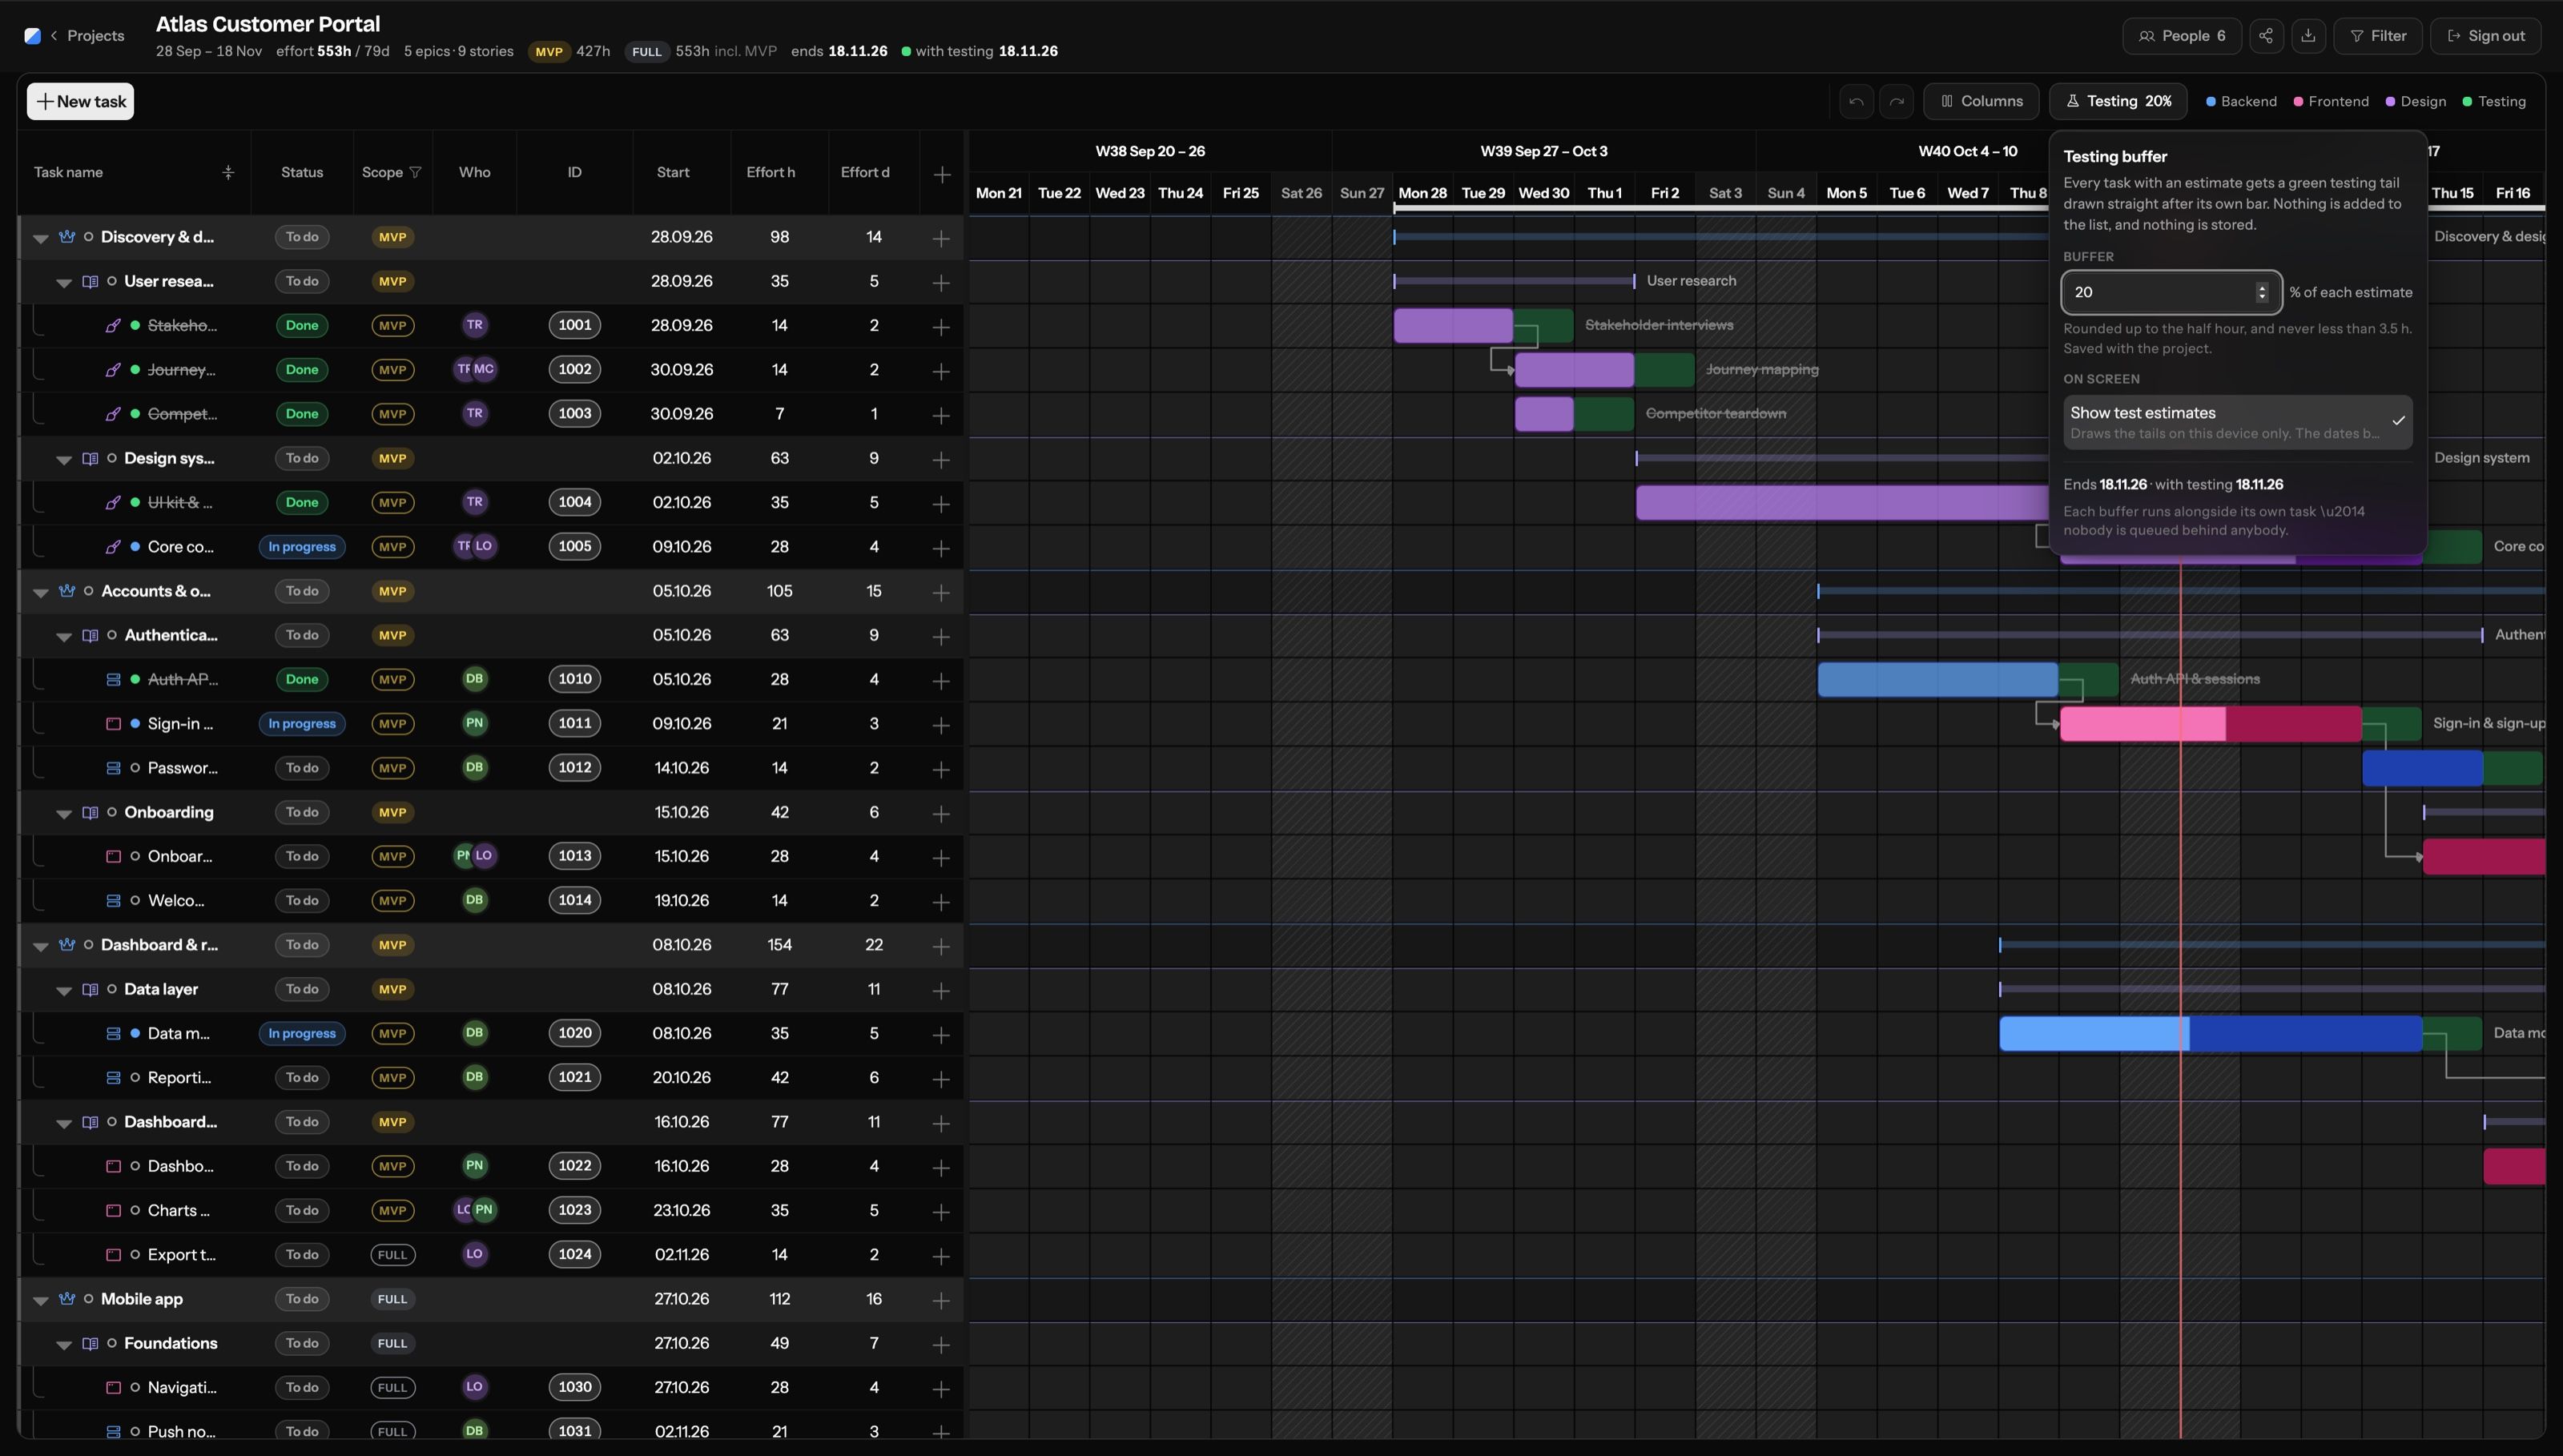
Every development task gets a testing tail right behind its bar, sized as a share of its own estimate. The share is set per project, rounded up to the half hour and never under 3.5 hours, so the estimated time for testing can be tuned. The header shows both the end date and the end date with testing, and the tails can be hidden without changing any data.
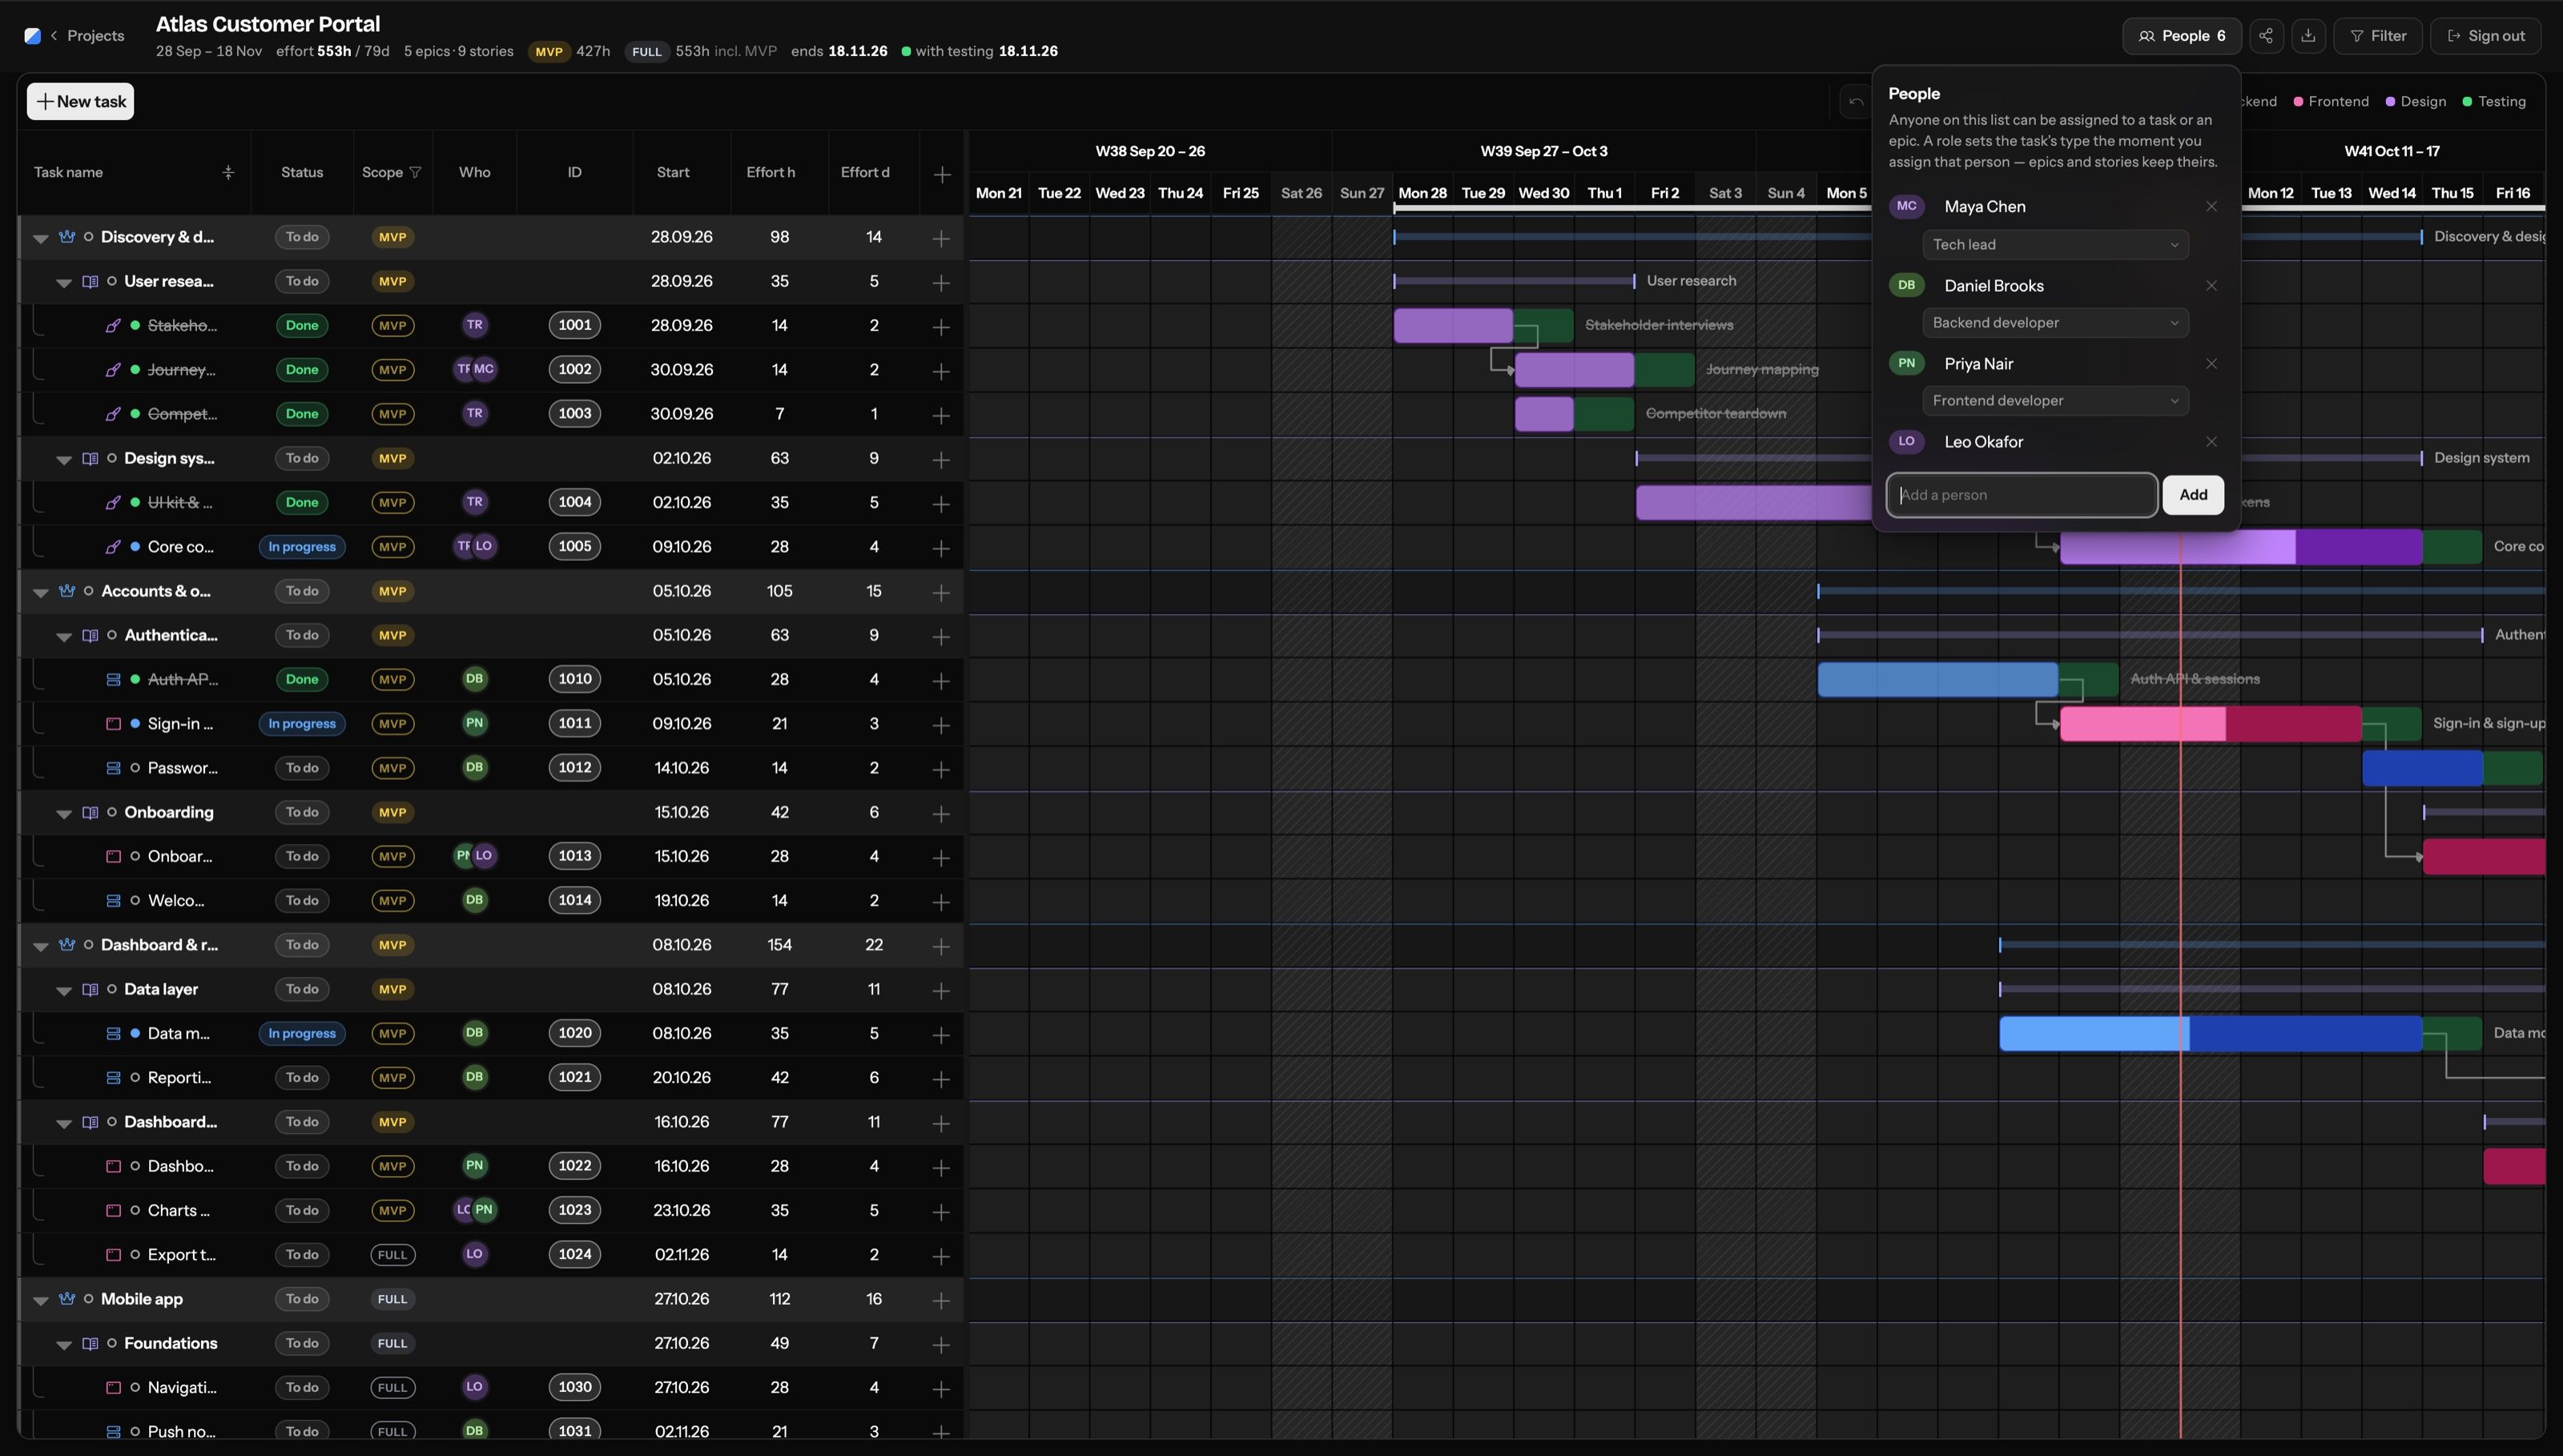
People and roles
A roster for the project. Giving someone a role, such as backend developer or tech lead, sets the type of any task you assign them, so the colours on the chart stay meaningful without extra clicks.
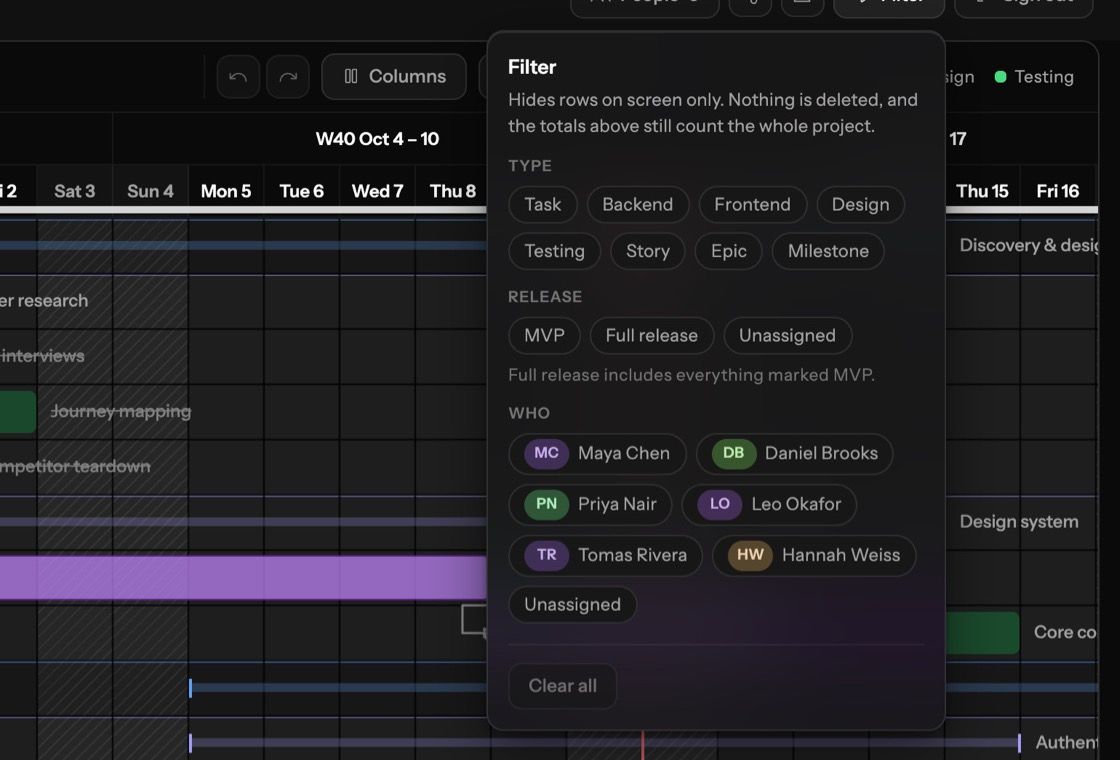
Filters that don't lose the totals
Filter by type, release scope or person. Filtering only hides rows on screen: the totals at the top still count the whole project, and the filter lives in the link so a view can be shared.
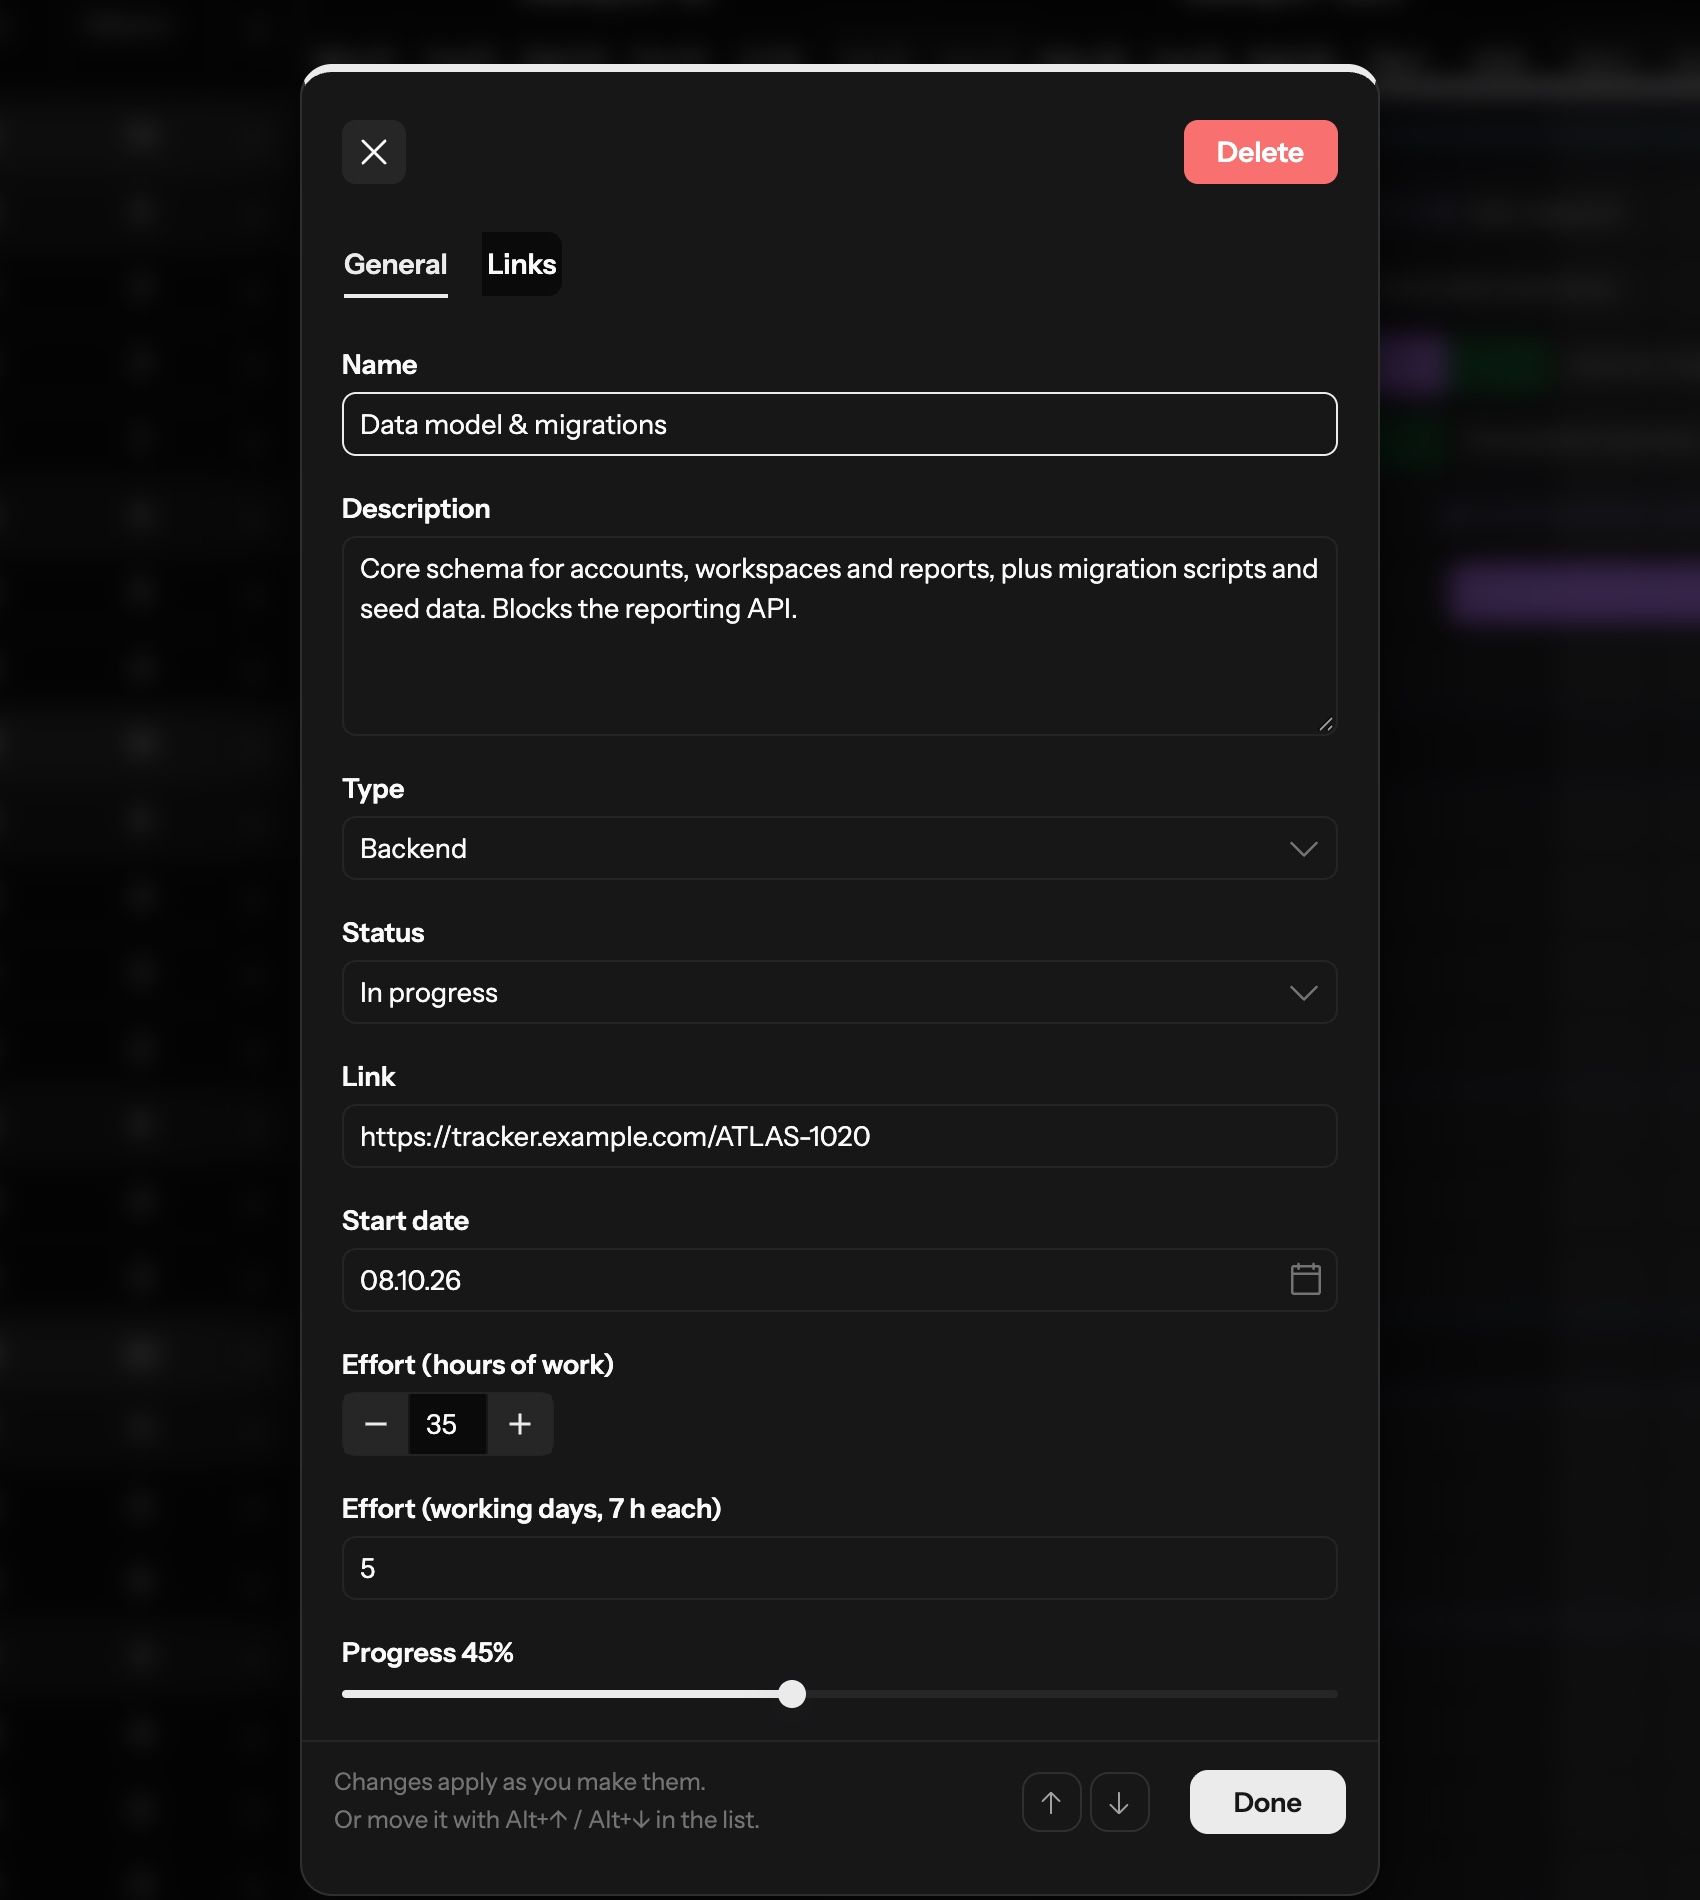
Edit without leaving the plan
Every row opens in a focused dialog. Estimates work in hours or in seven-hour days and stay in sync, changes apply as you make them, and Alt plus the arrow keys reorder rows from the keyboard.
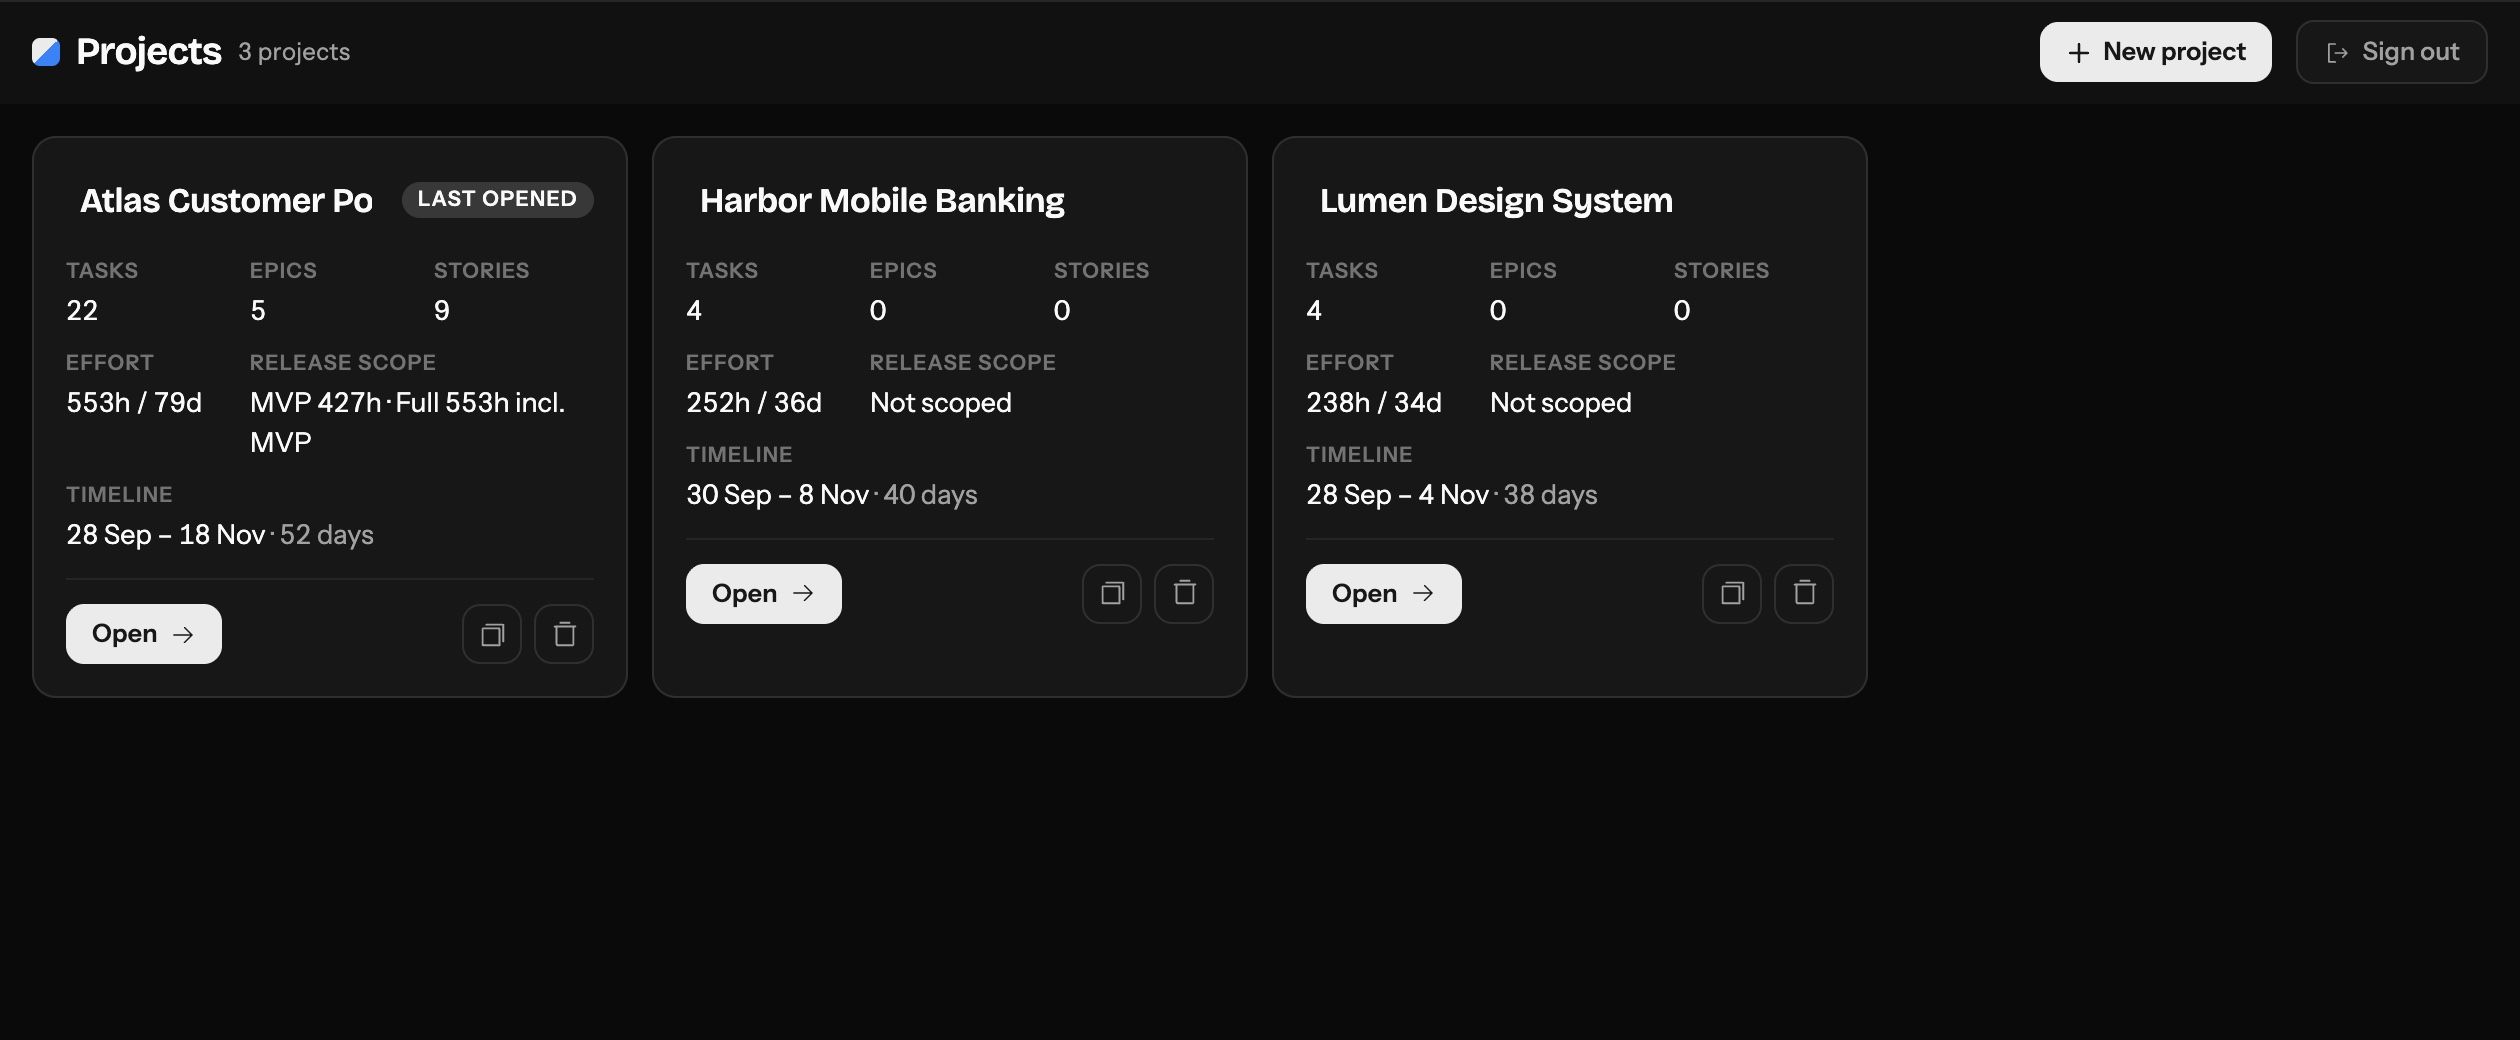
Every project at a glance
The projects list shows counts, effort, release scope and timeline on each card, so even two projects with the same name are easy to tell apart.
Light and dark, automatically
The whole interface has a designed light theme and a designed dark theme, including the chart, status colours and task types. It follows your system setting, so the plan looks right in a bright office and late at night. The screens in this case study are the dark theme; this one is light.
Next project
Novello →